Multimodal framework for Automatic Behavior Analysis of Children with Autism during ADOS-2
Bruno Carlos Dos Santos Melício, Kaan Karakose, Ádám Fodor, Linyun Xiang, Viktor Varga, Latha Soorya, Emily Dillon, Peter Kun, Andras Sárkány, Mohamed Chetouani, Kristian Fenech and András Lőrincz
Abstract
The rising prevalence of autism spectrum disorder, coupled with limited professional resources, highlights the urgency of developing efficient diagnostic tools. While standardized assessments exist, identifying subtle communication deficits, especially during multimodal interactions, remains time-consuming and prone to human error. To address this, we propose an automated behavior analysis framework that aims to support clinicians by accurately detecting both verbal and non-verbal communication markers. Specifically, we put forth a composite artificial intelligence framework that integrates various deep learning algorithms to analyze information from body and hand poses, object detection, tracking and manipulation, and speech. By combining these features with a rule-based system, we can identify events within the Autism Diagnostic Observation Schedule second edition, Construction Task, where participants initiate requests. These requests can be verbal, non-verbal or a combination of both resulting in multimodal interactions. Building on our prior work, this paper introduces a smart glass technology component, integrating gaze and blinking analysis, which are challenging for clinicians to monitor, given the multi-task nature of their role. These additions enable the detection of eye contact, a crucial social cue. Our approach allows us to recognize gestures, identify hand object manipulations, detect eye contact, and understand the natural language in clinician-participant interactions. We achieve 94% and 73% F-1 score, on verbal and non-verbal request detection, respectively, which may improve, as deep learning advances.
- Analyze social behavior of children with autism spectrum disorder (ASD) during the Autism Diagnostic Observation Schedule second edition (ADOS-2), specifically focusing on the Construction Task (CT) of Module 3.
- Automatically detect and interpret verbal and non-verbal communication requests made by participants during the task.
- Capture subtle social cues such as gestures, hand-object manipulations, gaze, blinking, and mutual eye contact to support clinical assessment.
- Provide clinicians with efficient, automated tools to reduce manual review time and improve understanding of communication behaviors in ASD diagnosis.
- Identifying nuanced social communication behaviors is difficult due to variability and complexity in verbal and non-verbal cues among ASD individuals.
- Detecting non-verbal gestures is challenging, especially when gestures are complex, combined, or context-dependent, often performed atypically by ASD participants.
- Speech recognition limitations arise from inaudible utterances, speech impairments, and transcription errors affecting verbal request detection.
- Intermittent and partial face visibility during the task hinders reliable gaze and blink detection.
- Synchronization of two unsynchronized video sources (wall camera and clinician’s Tobii glasses) is required for accurate multimodal analysis.
- Small sample size and imbalanced participant groups limit the generalizability and statistical significance of findings.
- Develop a Composite Artificial Intelligence (CAI) framework combining deep learning and rule-based systems for interpretable behavior analysis.
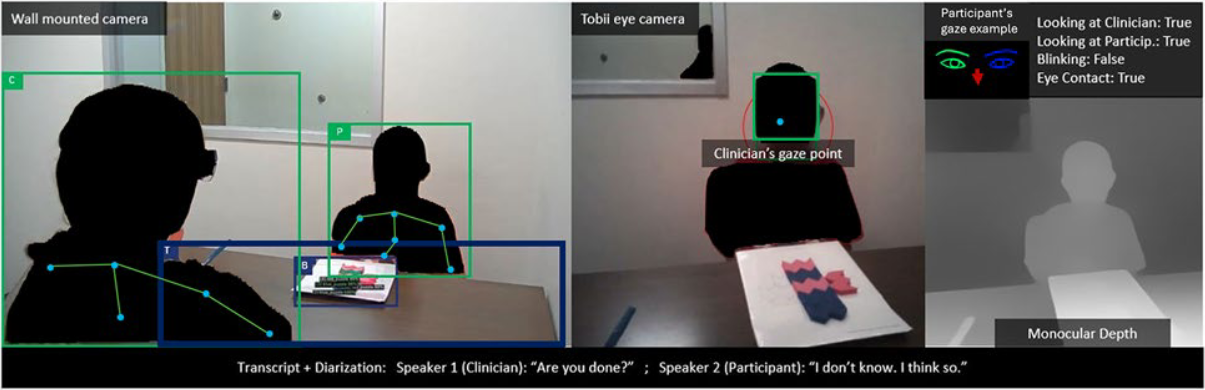
- Feature Extraction module uses state-of-the-art models for body and hand pose estimation, object detection and segmentation, speech transcription and diarization, gaze and blink detection (BlinkLinMulT).
- Episode Segmentation module applies rules to classify session intervals into Start, Interaction, Transition (request), and End episodes, focusing analysis on key moments.
- Activity Interpretation module integrates multimodal features to detect verbal requests using vocabulary matching, gesture recognition via MediaPipe, hand-object manipulation analysis, and mutual eye contact detection.
- Utilize dual synchronization methods (text-based and audio correlation) to align video streams from separate cameras for integrated analysis.
- Incorporate Tobii eye-tracking glasses to enhance clinician gaze data for mutual eye contact estimation.
- Verbal request detection achieved 94% F1 score, 100% precision, and 88% recall, with failures mainly due to transcription errors and inaudible speech.
- Gesture-based non-verbal request detection reached 73% F1 score, perfect precision but lower recall (57%), indicating challenges with complex gestures in ASD.
- Successfully detected gaze, blinking, and mutual eye contact during request intervals, revealing significant variability and individual differences in social communication behavior.
- The episode-based segmentation approach resulted in zero false positives and reduced computational load.
- The framework supports clinicians by automating time-consuming analyses and providing detailed social cue insights, supplementing but not replacing clinical judgment.
- Recommendations for future work include expanding datasets, improving gesture recognition with temporal models, refining speech transcription, and personalized participant characterization.
Visualization
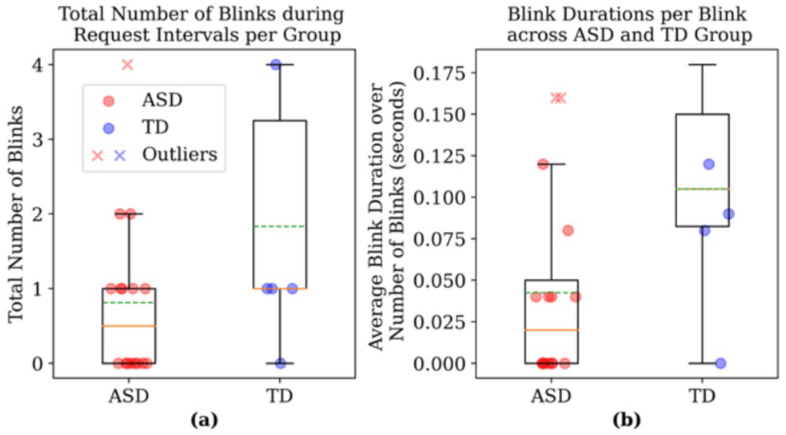
a) Box plot for total number of blinks per group, alongside the
data points. Eight out of 16 ASD and 5 out of 6 TD participants were
blinking. An outlier can be observed among the ASD participants.
b) Box plot for average blink duration over number of blinks per group,
alongside the data points. Outliers can be observed among the ASD
participants.